Orbiting Carbon Observatory-2OCO-2
The goal of the OCO-2 Validation effort is to tie the satellite data from OCO-2 to the standard defined by World Meteorological Organization (WMO).
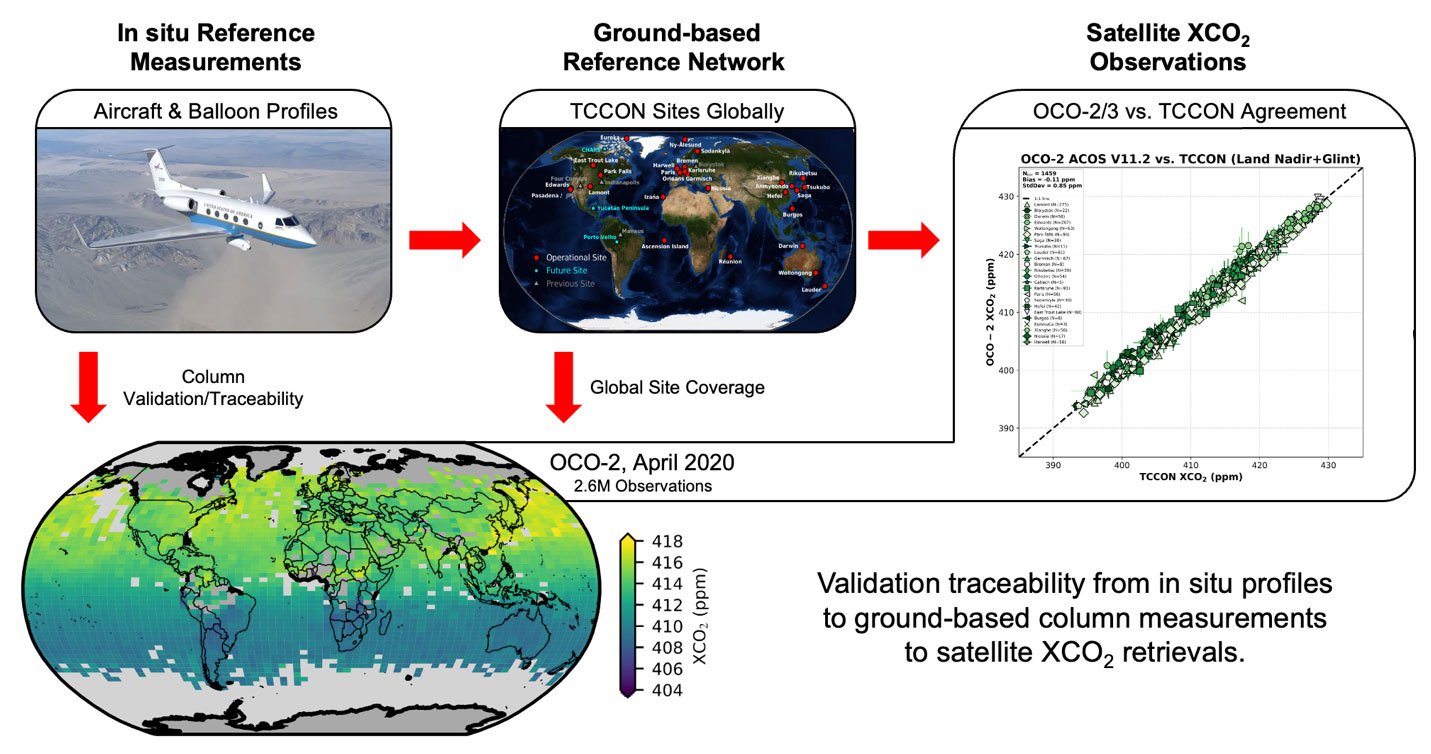
The OCO-2 team works in a step-wise fashion comparing observations to get to the WMO standard.
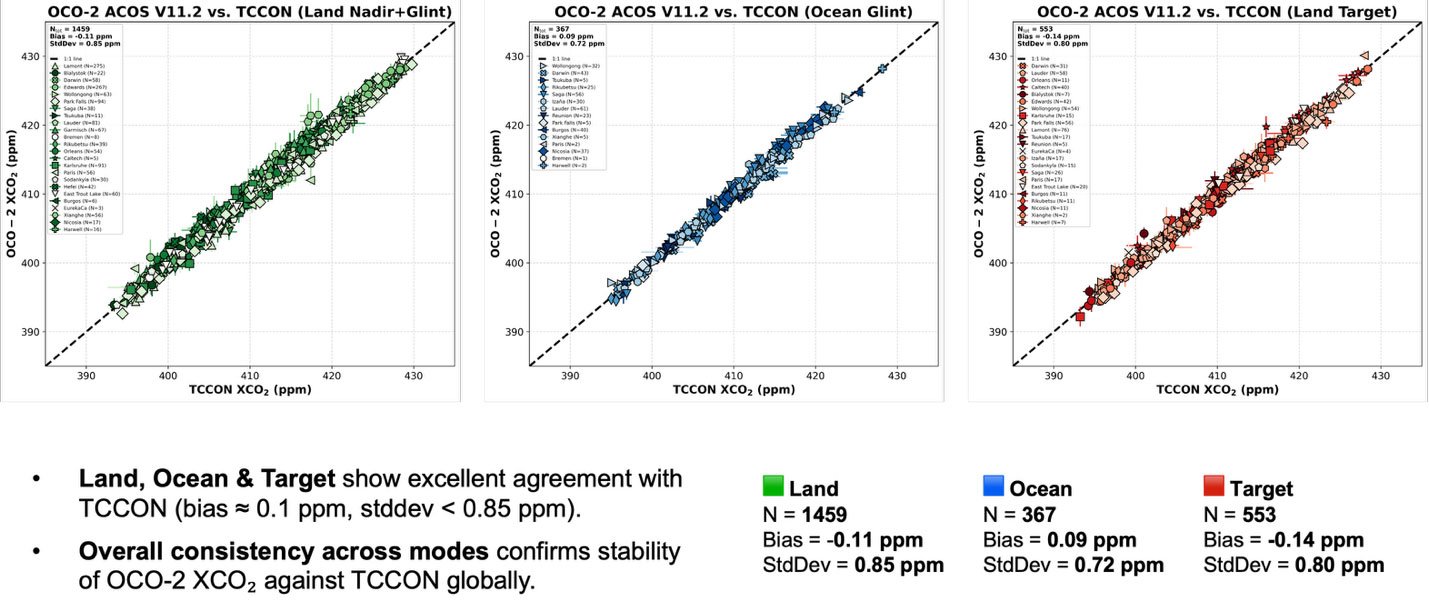
The first step is to compare the OCO-2 measurements of total column dry-air mole fractions of CO₂ (XCO₂) to the very precise XCO₂ measurements from the ground-based Total Carbon Column Observing Network (TCCON). This is where most of the validation effort is concentrated: the comparisons to TCCON allow us to “validate” our data.
The second step involves comparing the TCCON data to independent observations made by aircraft and balloon-borne instruments during various campaigns.
The final step of the process is done by comparing the data to aircraft and balloons because those measurements can be directly tied to the WMO standard. Most of the effort on OCO-2 validation involves step 1: comparison to the ground based TCCON data. The team also supports efforts for getting data for step 2 at the TCCON sites.
What is TCCON? More information can be found at TCCON Web.
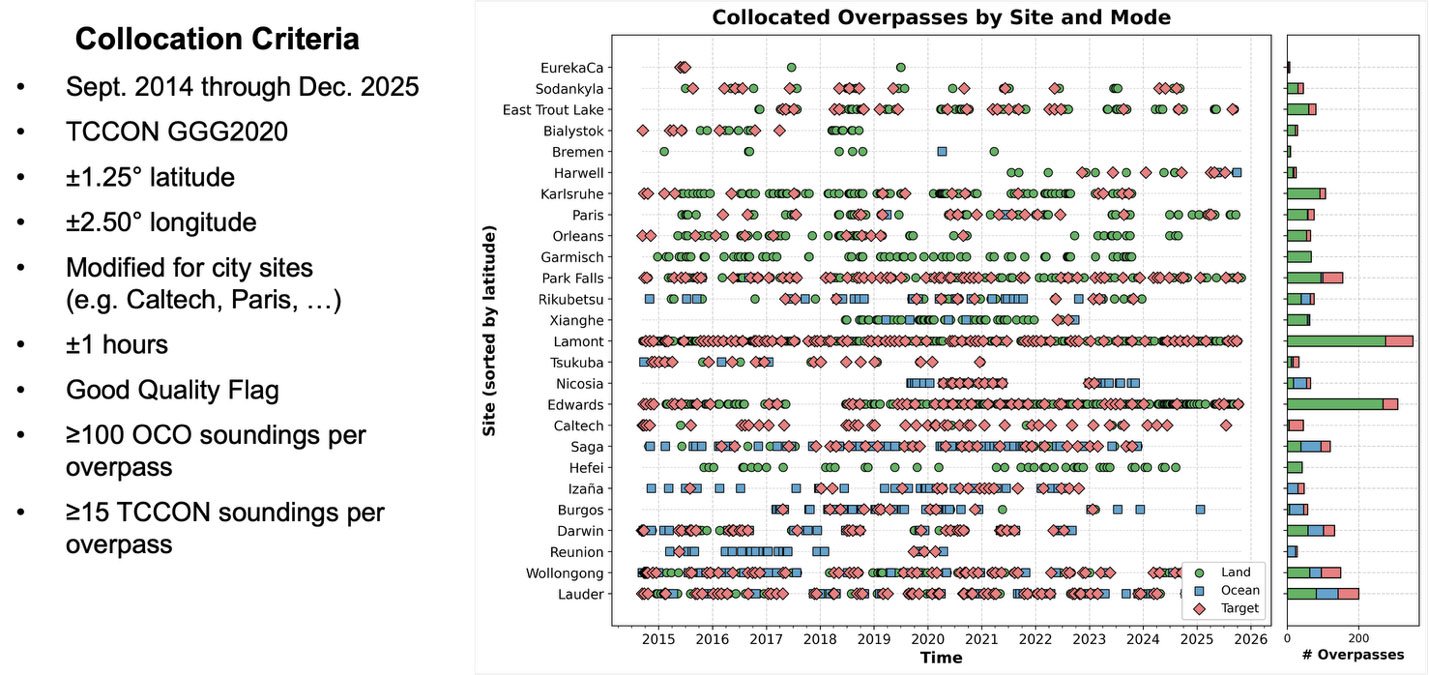
Target observations are a key component of the OCO-2 validation plan. Target locations are selected because of science or geographical interests, and most of the target locations are selected to be TCCON sites or calibration sites. OCO-2 averages about 8-10 target observations per month, though instrument status, TCCON site status, and cloudy weather can affect the actual number of observations.
Accuracy and precision of XCO₂ < 0.85 ppm
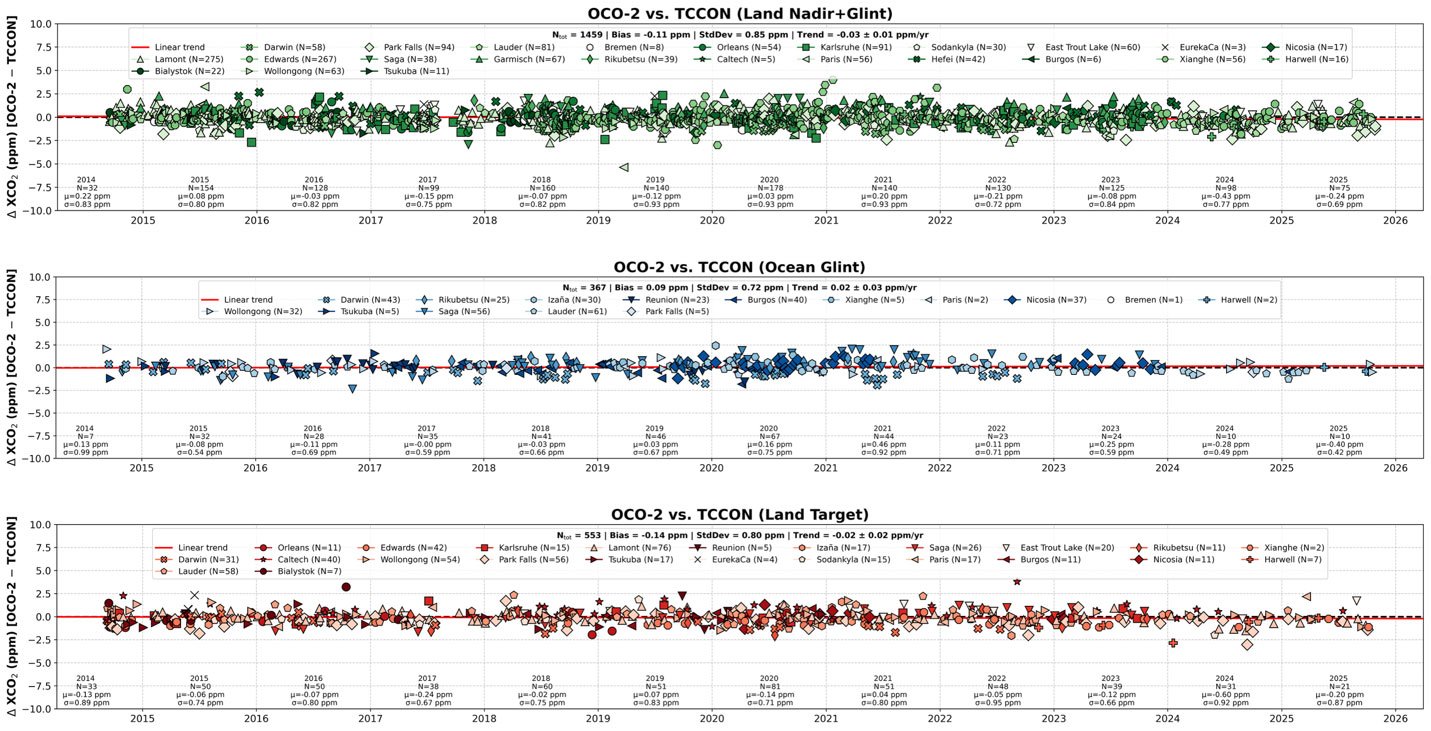
The instrument is stable over more than 10-year of record, no obvious trend comparing to TCCON observations.